Brighton Science
It’s never been easier to assess surface readiness and collaborate with confidence.
Brighton Science challenged our team to develop a streamlined and user-centric solution for managing Gage, Repeatability, and Reproducibility (GR&R) experiments. The goal was to move beyond the limitations of Excel spreadsheets and manual data entry to create a more efficient and visually intuitive approach.
Our focus was to design a dedicated GR&R Project page that consolidates key data and graphs into a clear, accessible interface. This enhancement empowers Quality Assurance managers to quickly evaluate whether a gage complies with GR&R standards, thereby improving decision-making and productivity.
Background
Team - Matt Collins, Allie Keith, EJ Makela, Trevor Charon, Mamoun Alassouli
Role - User Journey Mapping, Prototyping and Annotated Wireframe creator
Date - October, 2024
Methods - Design critique, artifact analysis, directed storytelling, design critique, journey mapping, Kano analysis, information architecture diagram, annotated wireframes, interactive wireframes
Tools - Google Slides, Google Docs, Figma, Figjam, Google sheets, Google forms
Brighton Science’s Surface Analyst is pivotal in assessing the readiness of product surfaces for bonding, adhesion, or coating by delivering precise measurements and critical data. When surfaces are improperly prepared, the consequences can be costly and time-consuming, with risks of wasted resources and potential safety hazards.
Although the Surface Analyst provides invaluable insights, the presentation of its data can benefit from greater clarity and simplicity. By redesigning the output to emphasize intuitive, at-a-glance pass or fail results, users would be empowered to make faster, more informed decisions. This enhancement would streamline processes, minimize errors, and further optimize the efficiency of surface preparation workflows.
Problem and Purpose
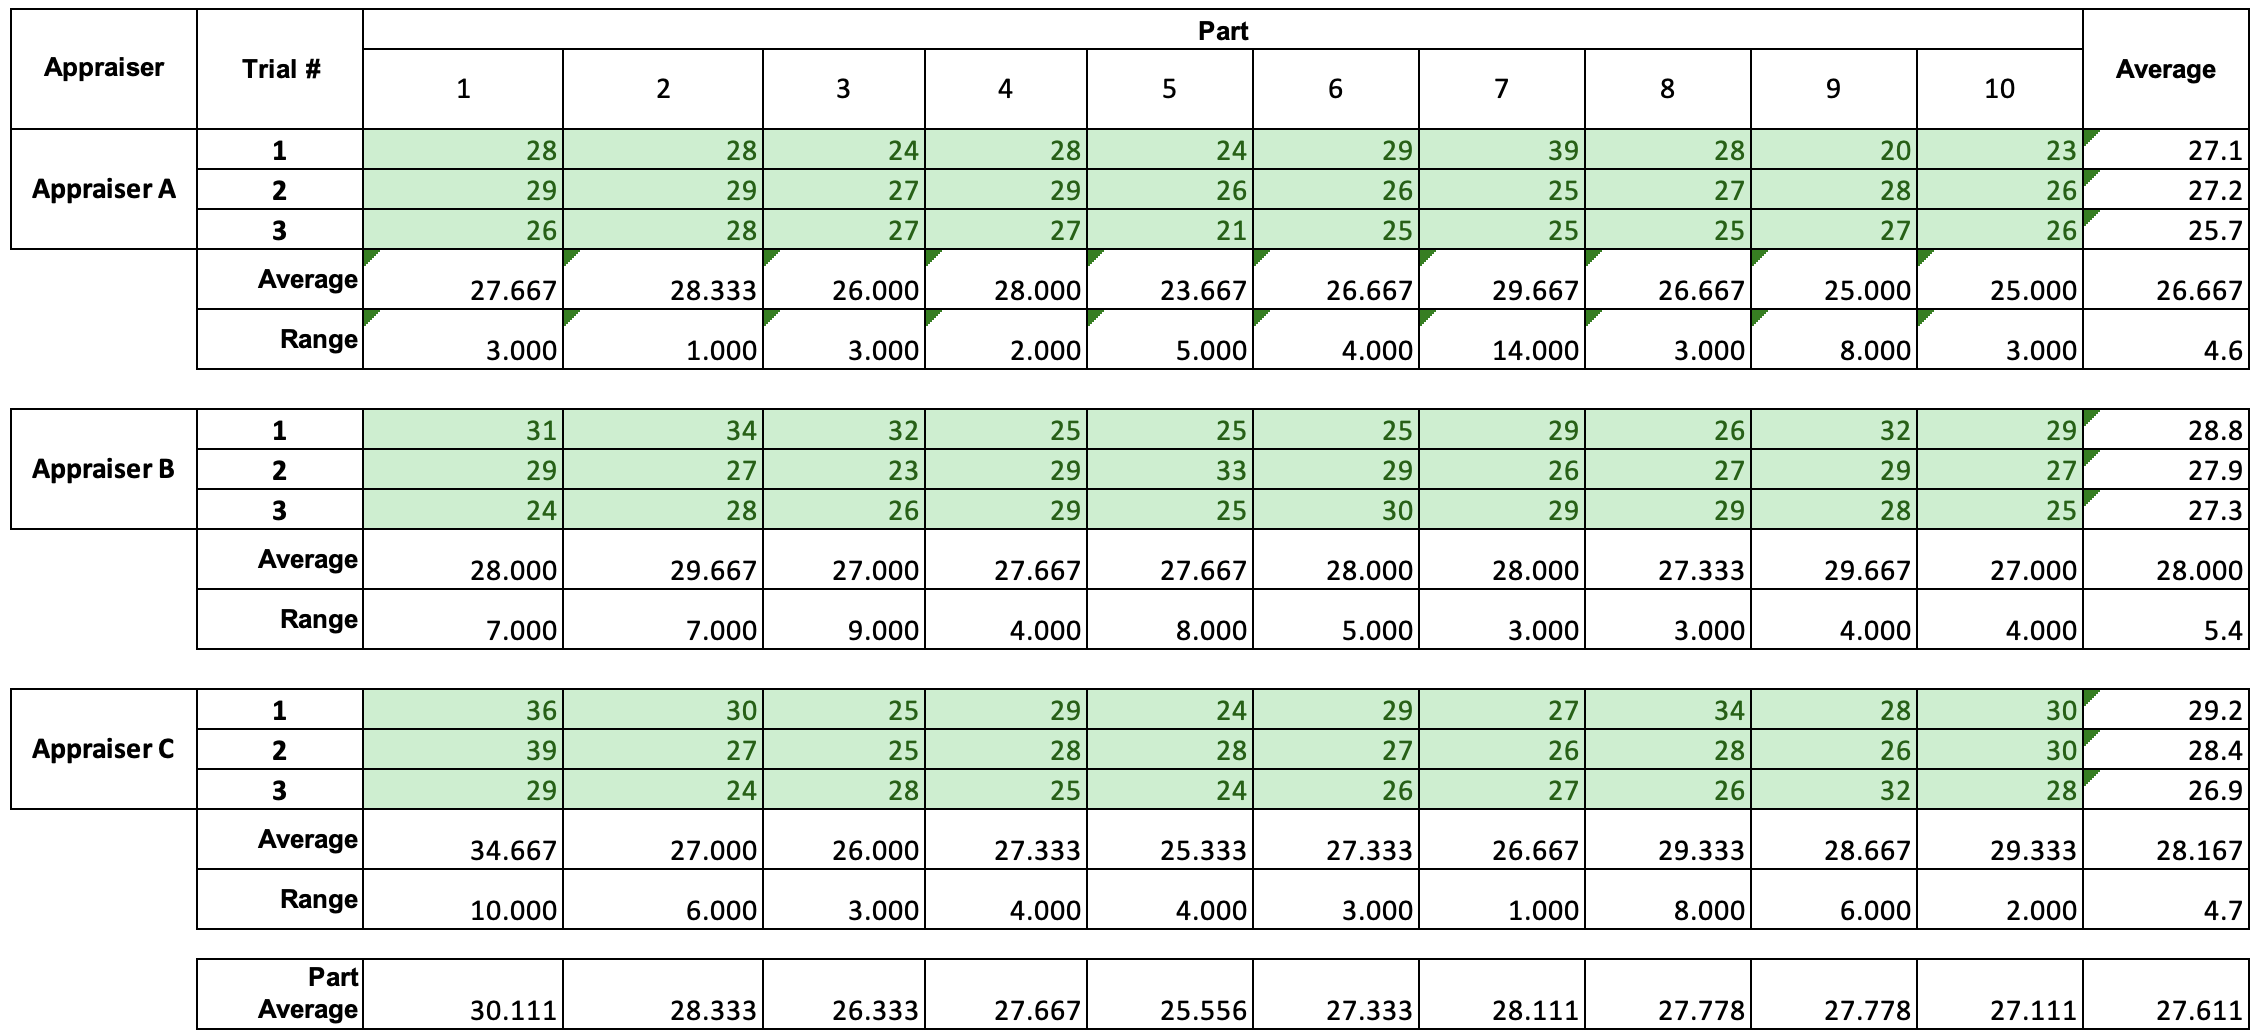
A example of some of the data that is reported to the users.
This data is important, but can be messy.
To thoroughly understand the challenges, I started with a stakeholder interview and an in-depth review of the data reports provided to users. This groundwork allowed me to identify the current state of the Surface Analyst’s workflow and its impact on user satisfaction.
Subsequently, I developed a user journey map to pinpoint specific pain points and uncover areas for potential improvement. A critical issue that surfaced was the time lag between capturing data with the Surface Analyst and analyzing the results. This delay not only hindered efficiency but also underscored an opportunity to streamline the process and enhance the overall user experience.
Iteration and Evaluation
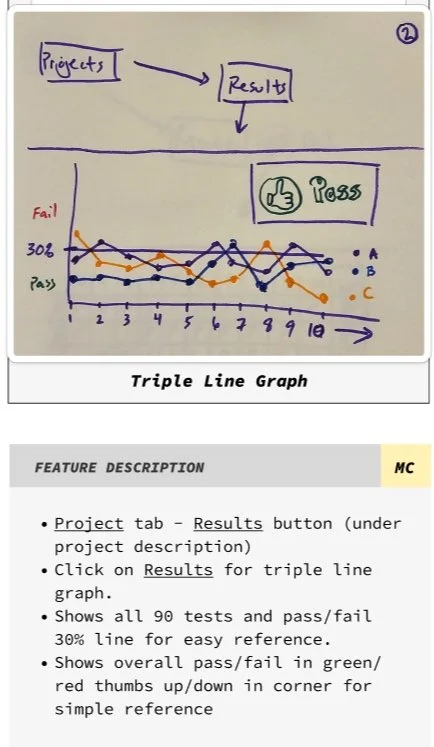
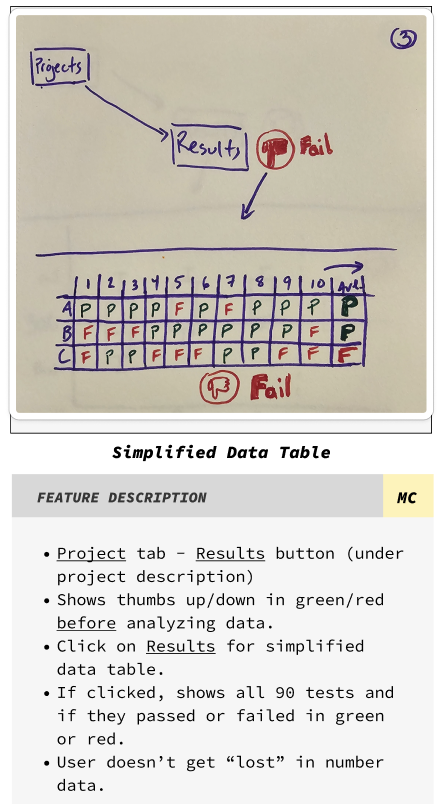
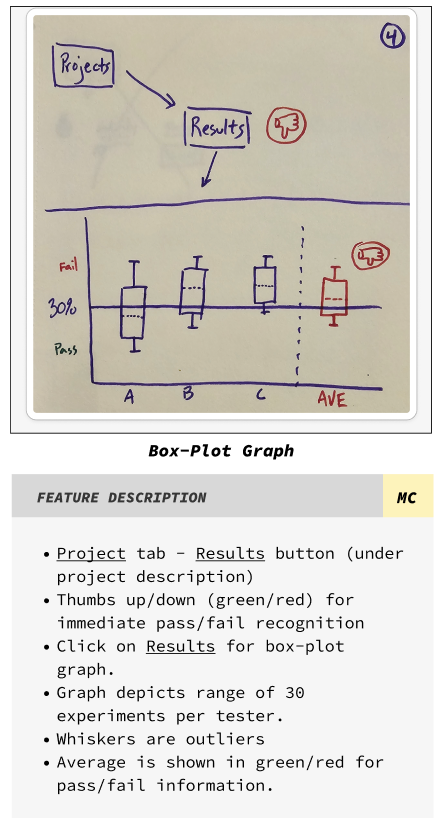
Building on the findings from the user journey map, I collaborated with my team to create low-fidelity wireframes that addressed the challenge of information overload in user feedback. My primary focus was on introducing a variety of intuitive graphs that could effectively convey critical insights.
These visualizations were carefully designed to present data in a clear and concise manner, enabling users to quickly understand the most important metrics without feeling overwhelmed by a sea of numerical details. By emphasizing simplicity and accessibility, the proposed wireframes aim to significantly improve the user experience, making data interpretation faster and more efficient.
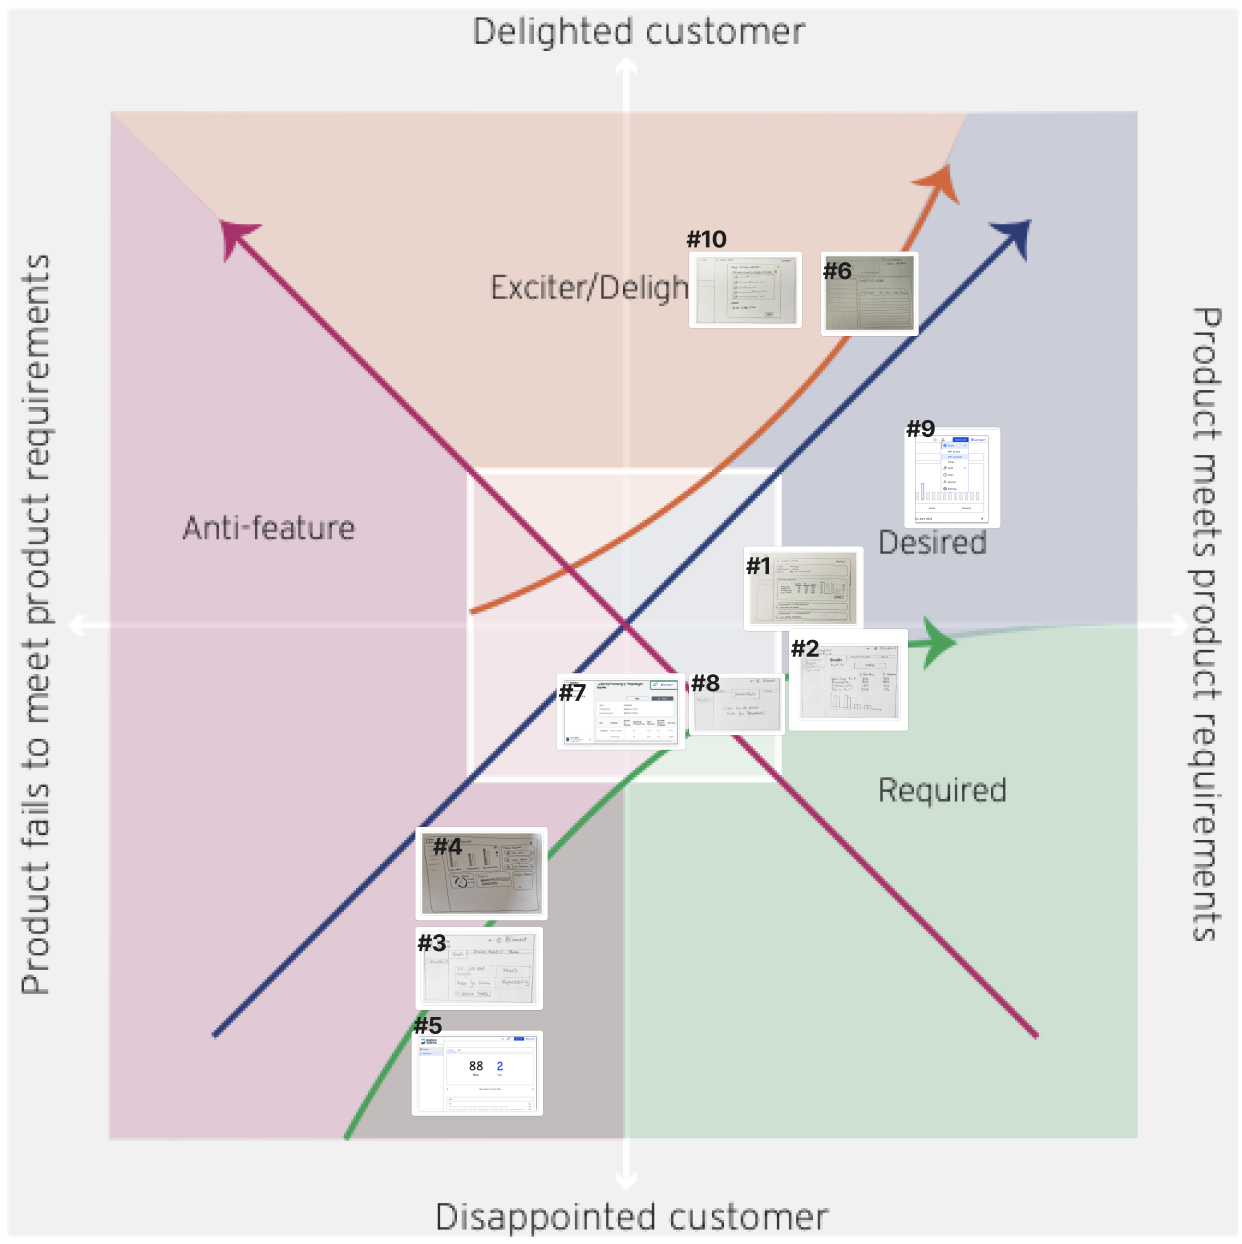
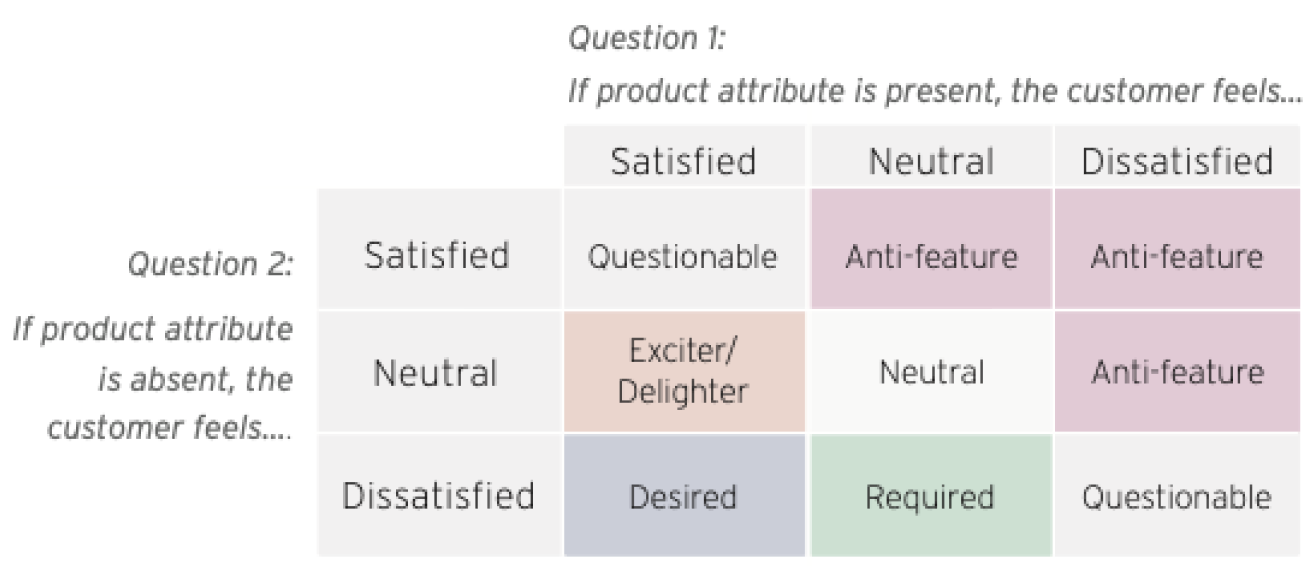
The Brighton Science stakeholders reviewed our wireframes and provided insightful feedback that guided our next steps. To refine the prototypes further, our team conducted a Kano analysis to evaluate which features were most desired by users. Based on the results, I prioritized the “desired” features when developing higher-fidelity annotated wireframes.
This approach ensured that the final designs effectively addressed user needs while remaining aligned with stakeholder expectations,creating a balanced and impactful solution.
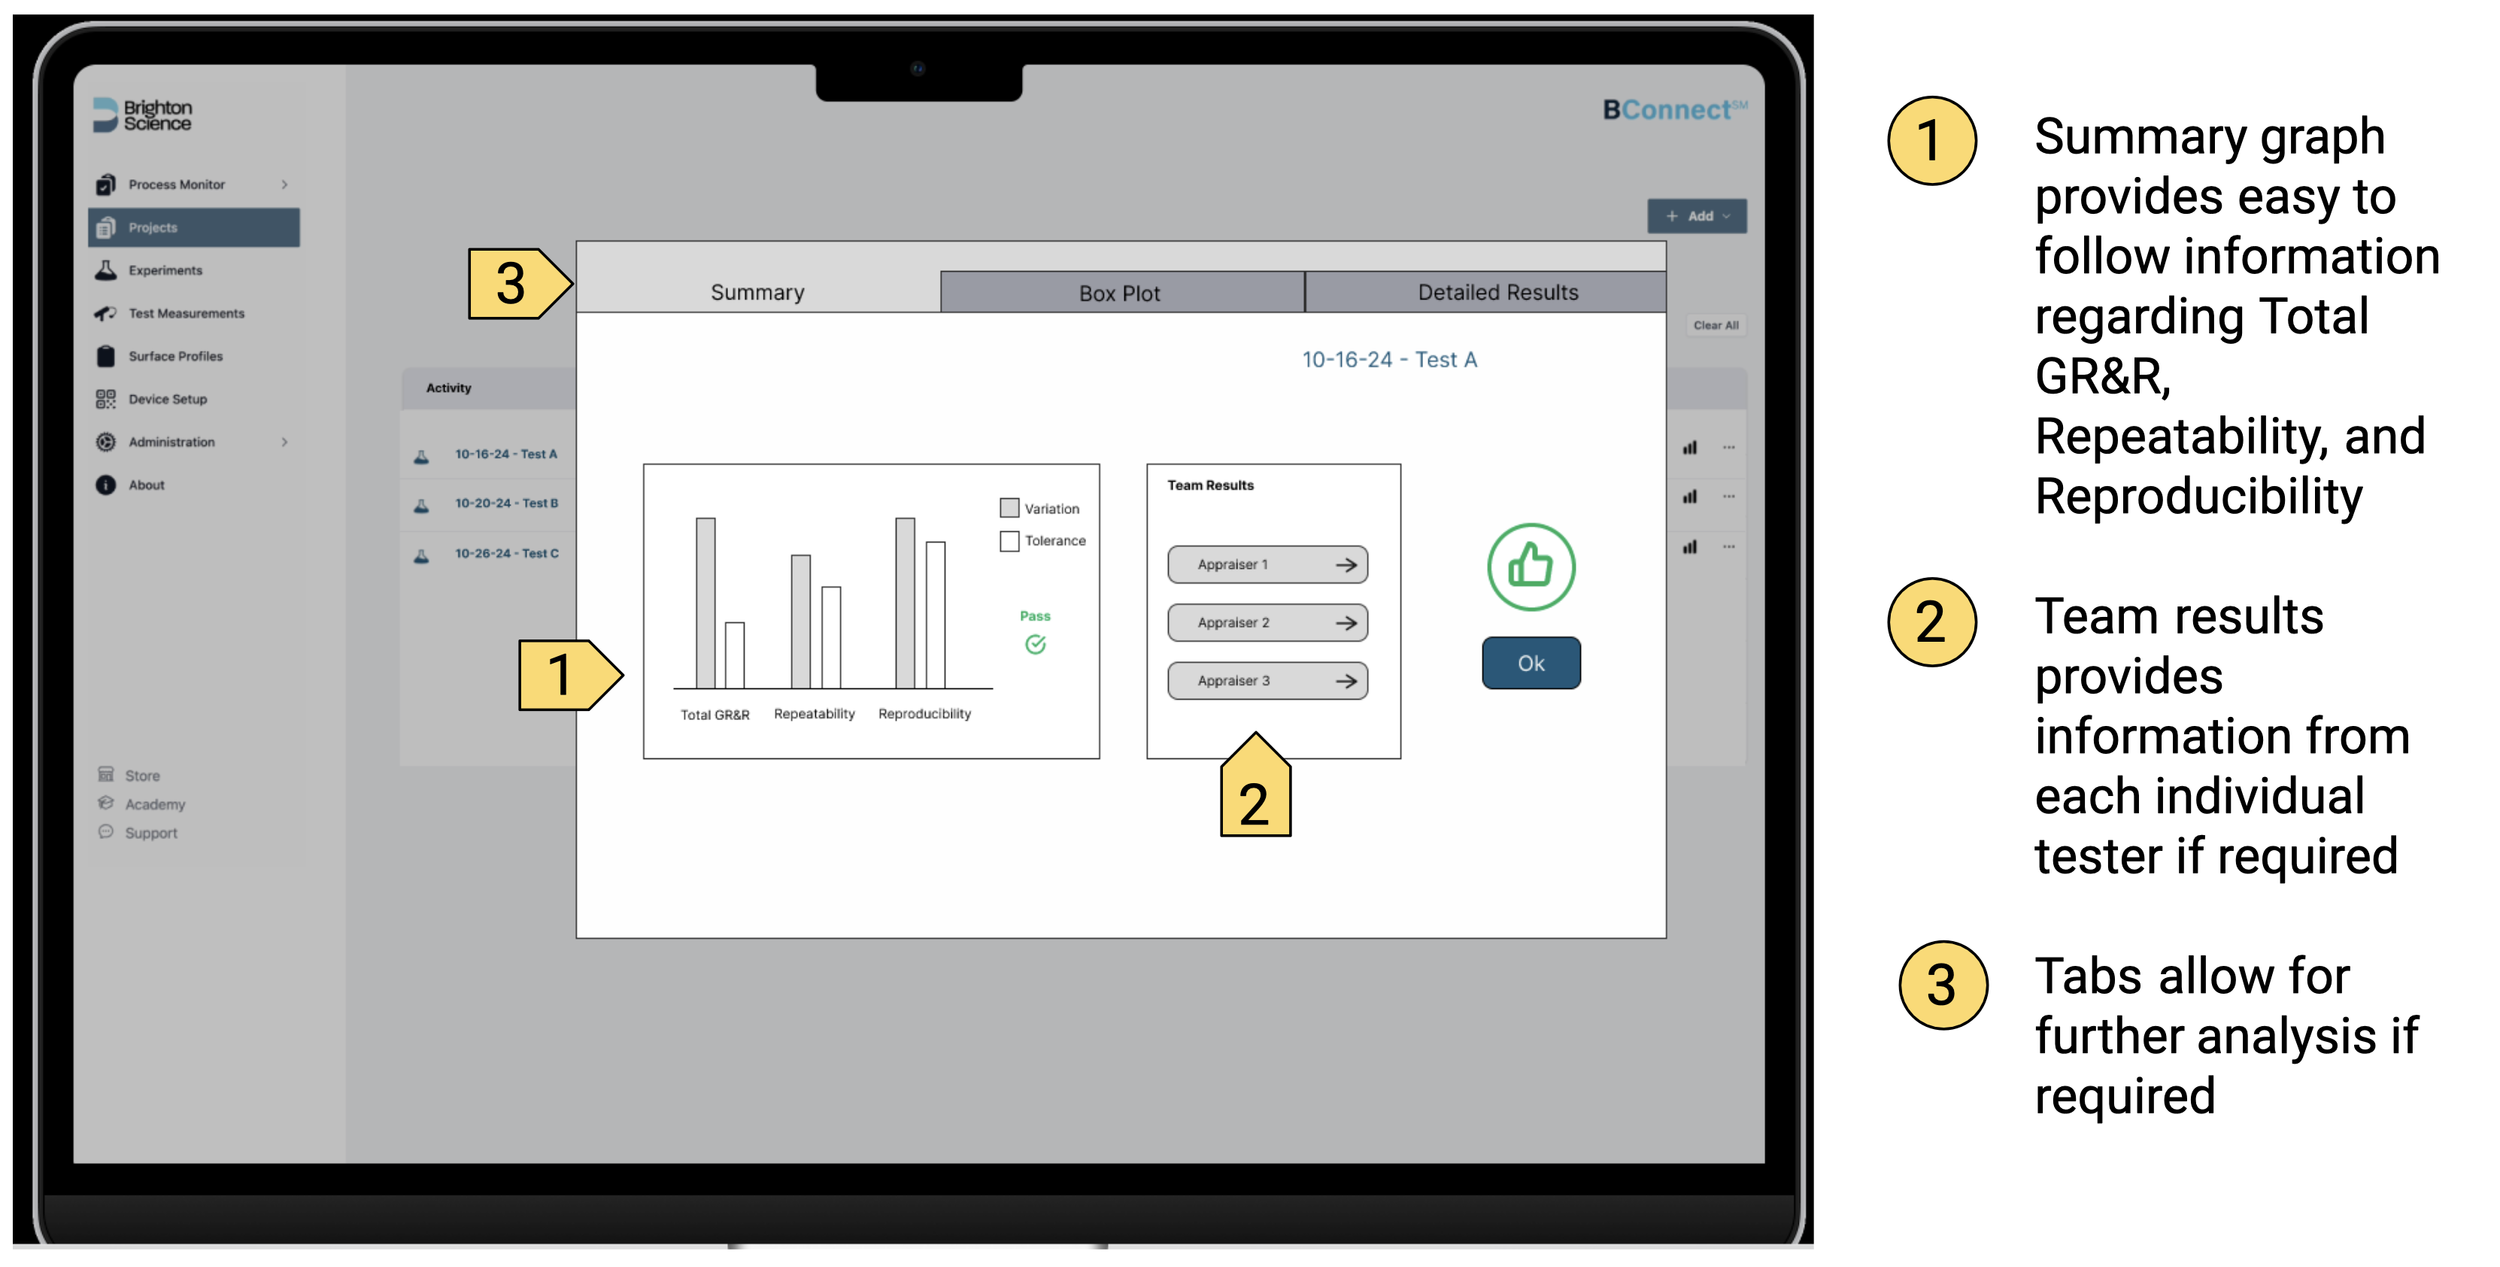
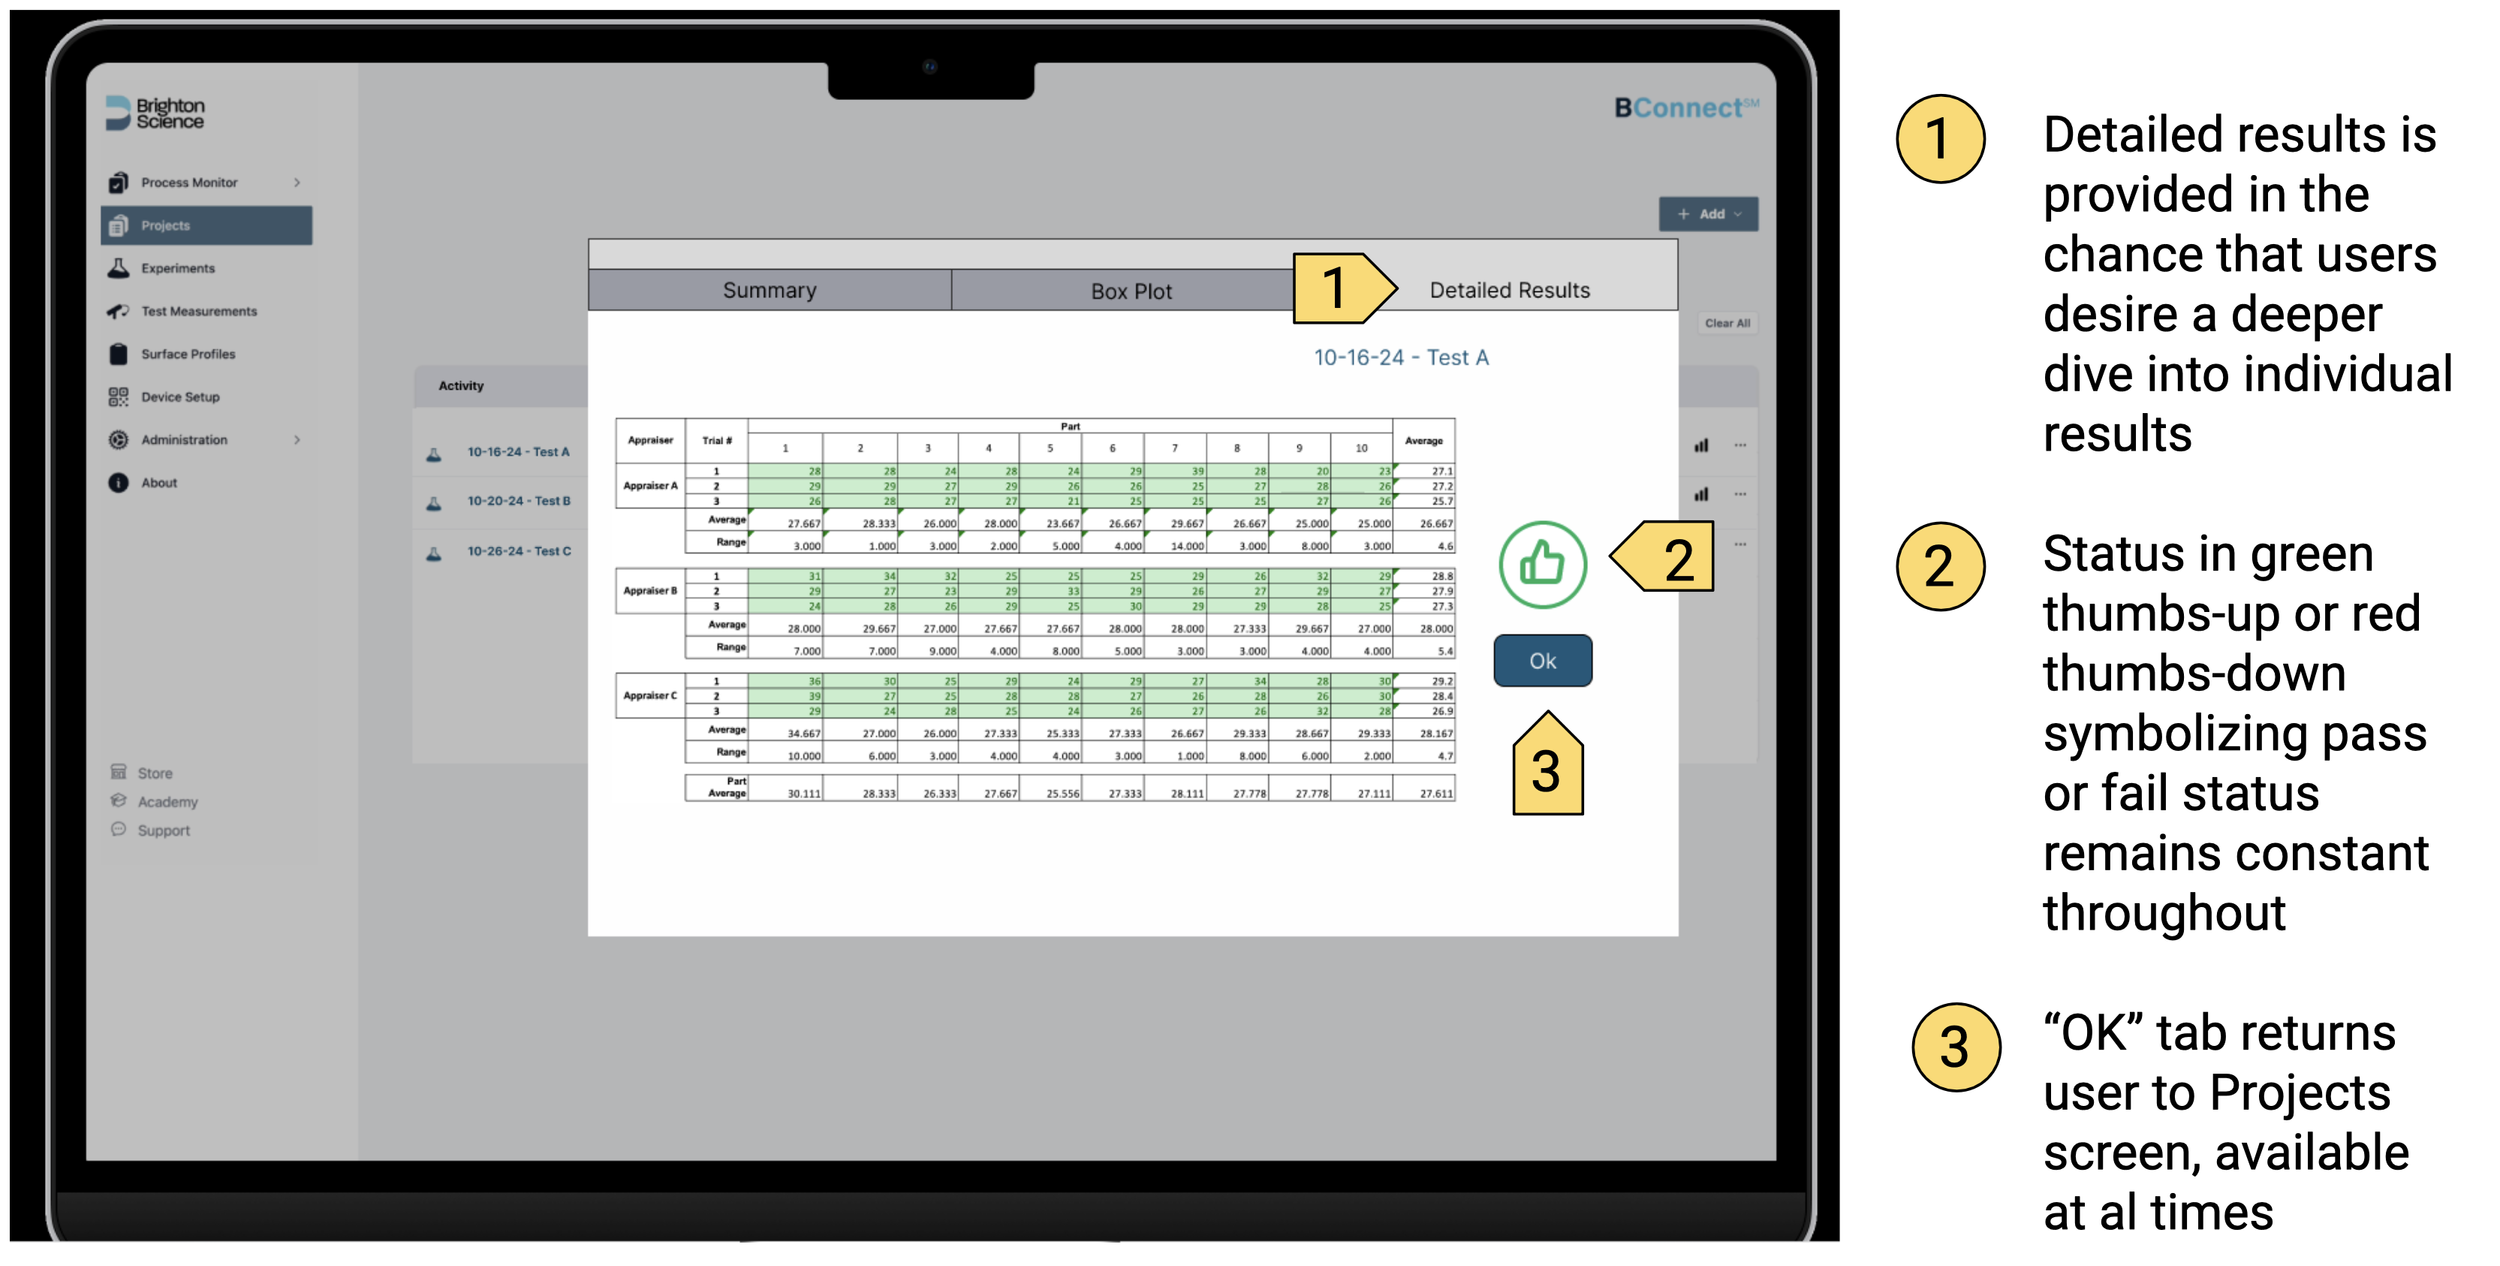
Finally, high-fidelity prototypes were developed and thoroughly annotated to provide detailed insight into the most impactful and effective changes for Brighton Science. These prototypes highlighted key improvements aimed at enhancing the user experience and simplifying the feedback provided to Surface Analyst users. The annotations served to clearly explain the rationale behind each design decision, ensuring alignment with both stakeholder goals and user needs.
Next Steps
If given more time on this project, I would prioritize further simplification of the visualization and verification processes for Total GR&R, Reliability, and Reproducibility. Additionally, I would conduct in-depth user research to better understand the specific data needs of diverse user groups. Leveraging these insights, I would design tailored graph packages that address the unique requirements of each segment, providing a more targeted, intuitive, and user-friendly experience. This approach would ensure that the solution aligns with both practical usability and stakeholder goals.


